SEO Performance Summary
This section uses data from your Google Analytics account and contains data from the last 30 days from when the report was created.
Note: if you see low or no statistics in this section, there could be a tracking issue with your Analytics. If goals are registering as 0, they may not be set up. Please contact us if either is the case.
It is divided into three sections:
Organic Impressions
The number of times your listing appeared in the Google search results followed by a trend graph of impressions from the past six months. The cost per impression shows the average cost of every time your listing appears in the Google search results.Organic Conversions
The total number of conversion actions recorded from organic traffic followed by a trend graph of conversion data from the past six months. A conversion (or goal) is a desired action on your website, like submitting an enquiry, buying a product or signing up to a newsletter. These goals are set up in your Google Analytics account and are used to measure if the traffic to your website is taking the desired actions you want them to.
Cost per organic conversion is the average cost of a conversion action from organic traffic to your website.
Organic Visits
The number of website visitors generated by your Google organic listing - total visitors and new visitors this month. Followed by a trend graph showing total visitors for the past six months. Cost per organic visit is the average cost of a visit to your website from Google's organic listings.There is also details provided on the average visit duration and the average page views per visit to your website.
Google Visibility
Your Google Visibility score shows how visible your website is in Google search results for the keywords we’re tracking. It’s one of the best indicators of your SEO progress - the higher your visibility, the more often people are seeing your business when they search on Google.
Your visibility is shown as a percentage, which represents how your keywords are ranking overall. As this percentage increases, it means your site is moving up the organic Google search results for your targeted keywords.
In your ROI report, you’ll also see your guaranteed visibility increase - the minimum level of improvement we aim to achieve within six months of your campaign going live. You can find this guarantee clearly displayed in the report (see example below).
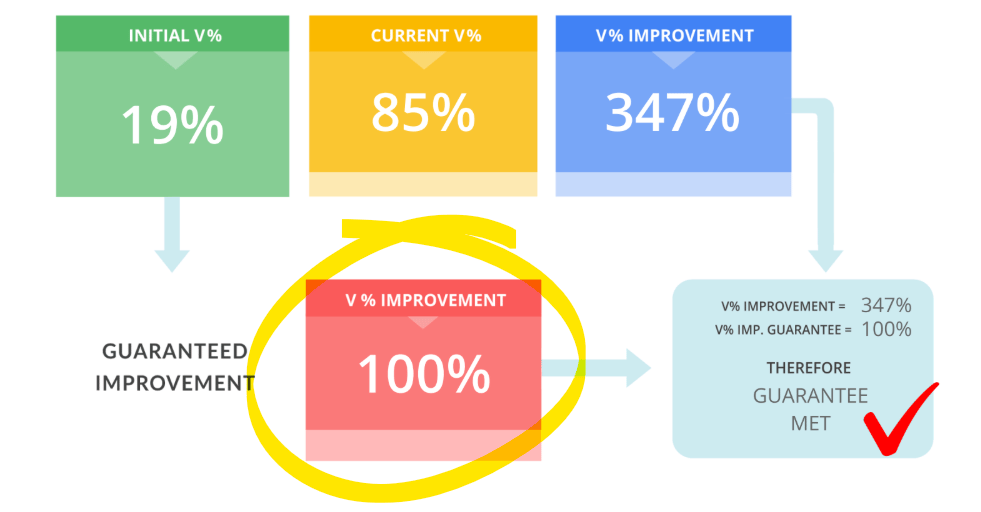
This guaranteed increase might be shown as either a percentage increase (for example, +100%) or a percentage point increase (for example, +30% points). Both measures reflect how much better your site should be performing compared with your starting benchmark - the visibility score we recorded at the beginning of your SEO campaign.
So, for example:
- If your benchmark visibility was 20% and your guarantee is a 100% improvement, that means we’re aiming to take your visibility to 40% — effectively doubling your website’s exposure on Google.
- If your guarantee is a 30 percentage point improvement, we’re targeting an increase from 20% to 50%.
Your visibility score and guaranteed improvement apply to google.co.nz, or for our Australian clients, google.com.au (including local listings), measured six months after your site goes live.
The key takeaway? As your visibility percentage rises, your business becomes easier to find online - putting you in front of more potential customers searching for what you offer.
Visibility points are awarded for each keyword based on the first 50 positions for the keyword in Google. A keyword in the number 1 position scores 100 points, with keywords that are more likely to be clicked on by a user getting a higher score than those that are unlikely, all the way down to a keyword in position number 50 (or lower) which scores zero.
This metric is included in our Web Genius SEO Package monthly reports and we hope it adds clarity and makes it easy to see the ranking performance of your website.
Keyword Rankings
Your ranking report shows the ranking progress of individual keywords. When reading your report please note, there are ten results per page, so any keywords that are ranking between position 1 and 10 are on the 1st page of Google.
For an explanation for each column, see below:
- Keyword: The keyword phrase that we are tracking in Google.
- Current Rank: This is the position the website is currently ranking for in Google, at the time the report was produced.
- Page: This is the page of the Google search results where the listing appears.
- URL: This is the URL of the page that is ranking highest for the particular keyword phrase.
- Start Rank: This is the position the website was ranking initially when we completed the first report.
- Life: This shows ranking movement against the initial rankings when we first started tracking the domain for keyword rankings.
- Local Pack: A tick signifies that the website was found in Local Pack of Google Maps results on page 1 of Google.
Incoming link profile:
This section provides insights into links from other websites pointing to your website over the last 90 days. As part of your SEO Service, Web Genius build links to your website. Links are the main factors involved in increasing your visibility in Google.
External backlinks: This is the total number of links from other websites pointing to your website.
Referring domains: This is the number of other websites like “webgenius.co.nz” that link to you. This is different from external links because instead of counting all links from pages on a website, it only counts the website linking to you.
Referring IPs: This is the number of different servers that host the websites that are linking to you.
Referring subnets: This is the number of different servers that host the websites that are linking to you in separate locations from each other.